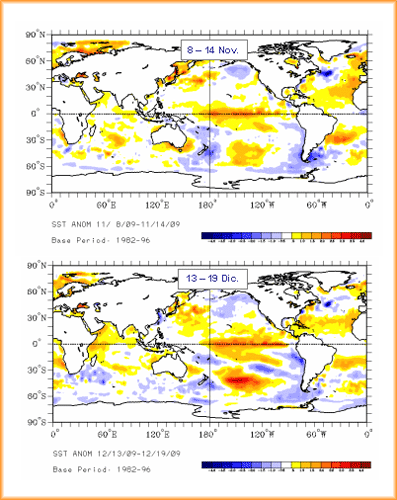
Campos de anomalía de temperatura superficial del mar en los periodos 8 – 14 noviembre 2009 (panel superior) y 13 – 19 diciembre 2009 (panel inferior).
Fuente: NOAA Earth System Research Laboratory, Physical Sciences Division, PSD Map Room Climate Products